October 3, 2016, Micah Blake McCurdy, @IneffectiveMath
I simulated the 2016-2017 NHL seasons a million times to estimate what is likely to
happen. I used a simulation
harness linked to my predictive model for single games,
Cordelia. Curious readers will
find lots of detail in those links, but the short version is that I consider offence and defence,
shooting and goaltending results, special teams, penalties drawn and taken, rest, and home
ice advantage. Injuries, suspensions, and all off-season moves are included.
The method I used is strongly similar to the one I used last year, with some key
improvements; some of the explanation is copied from last year's preview.
Eastern Conference Point Totals
Team
Mean points
Standard Deviation
Penguins
100.0
8.3
Capitals
98.1
8.3
Lightning
97.8
8.4
Canadiens
96.4
8.4
Panthers
95.7
8.4
Islanders
95.3
8.4
Flyers
94.6
8.4
Red Wings
94.2
8.4
Bruins
94.0
8.4
Rangers
92.3
8.4
Hurricanes
90.4
8.4
Senators
90.2
8.4
Maple Leafs
87.8
8.4
Devils
87.3
8.4
Blue Jackets
87.1
8.4
Sabres
83.1
8.4
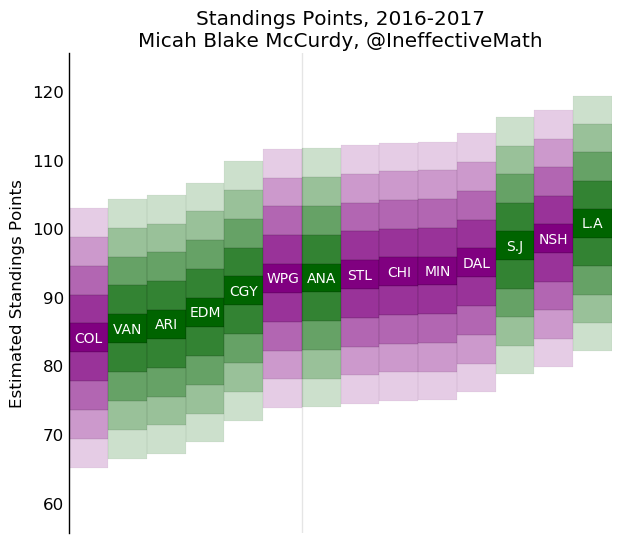
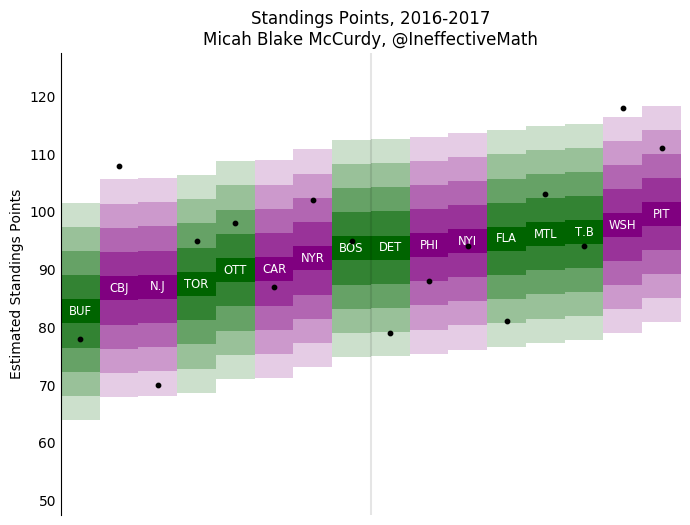
Each team's bar is centred on the average point total obtained in the simulations for each team,
sorted with the highest averages to the right, with the divisions indicated by colour.
The changing colour intensities indicate "stanines", that is, each coloured square shows half
of one standard deviation.
Thus, for instance, there is a 20% chance that Detroit finishes with between 92.1 and 96.3 points;
the two adjacent boxes each represent a chance 17%, the next two 12% each, the next two 7% each, and the
extreme pair 4% each. The darknesses of the boxes are chosen to reflect these probabilities.
Thus, we expect around six of the teams to finish in the darkest box, around ten to fall into
the adjacent boxes, around seven to fall into the next pair of boxes, around four into the next
pair, and one or two teams to fall into the faintest boxes. These one or two teams, which I make
no attempt to predict ahead of time, will be much discussed. The proximate cause of their success
or failure will doubtless be a superhuman goaltending performance, like Carey Price in 2014-2015,
or a horrific cavalcade of injuries, like Columbus in 2014-2015, or an exuberance of last-minute
goals and hot shooting, like Calgary in 2014-2015. Part of why I make predictive models is that
I enjoy knowing just how unlikely are the various unlikely things that happen every year.
Playoff cutoffs: 93.4 in the Metropolitan, 94.1 in the Atlantic.
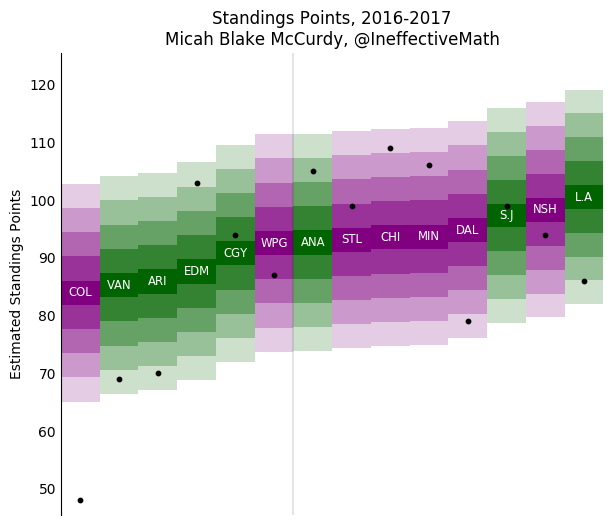
Western Conference Point Totals
Team
Mean points
Standard Deviation
Kings
101.0
8.4
Predators
98.7
8.3
Sharks
97.7
8.4
Stars
95.2
8.4
Wild
94.0
8.4
Blackhawks
93.9
8.3
Blues
93.5
8.4
Ducks
93.0
8.4
Jets
92.9
8.4
Flames
91.1
8.4
Oilers
87.9
8.4
Coyotes
86.2
8.4
Canucks
85.6
8.4
Avalanche
84.2
8.4
The West is tighter than the East, especially in the middle where the churn for the
bubble playoffs spots is. The central teams have a decisive upper hand, though the pacific
is by and large weak enough to make the Central easier to make the playoffs from than the
Metropolitan.
Playoff cutoffs: 92.0 in the Pacific, 93.2 in the Central.
Divisional Breakdowns
Atlantic Division
Team
Playoff Chance
Lightning
69%
Canadiens
67%
Panthers
64%
Red Wings
57%
Bruins
56%
Senators
38%
Maple Leafs
28%
Sabres
13%
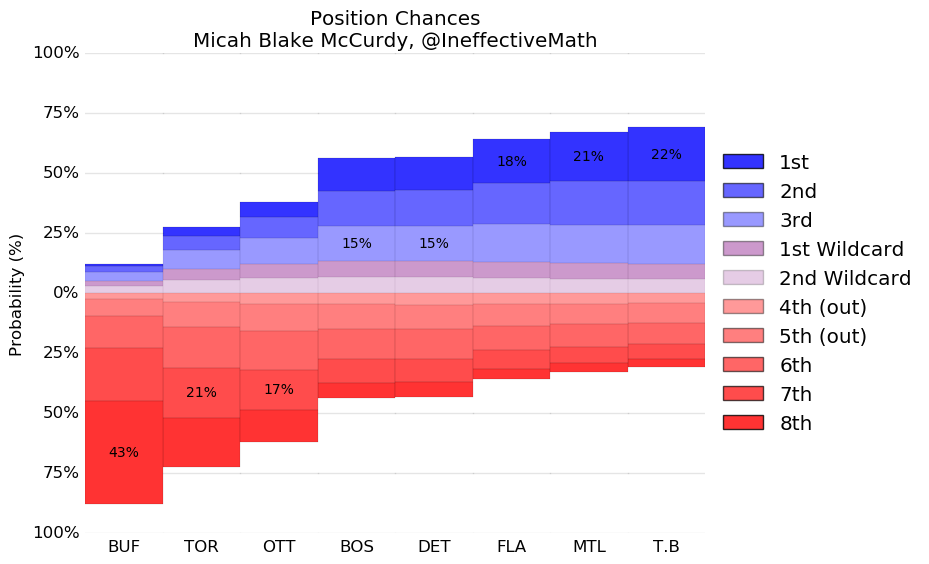
Every team's most likely finishing position is marked---all three of Florida, Montreal,
and Tampa Bay are more likely to finish first in the Atlantic than in any other particular
position, which is another way of seeing just how tight the division is. Buffalo will
need to see considerably larger improvements from their young players than is likely if they are
to make the playoffs; the same to a lesser degree is true of Toronto.
Metropolitan Division
Team
Playoff Chance
Penguins
80%
Capitals
74%
Islanders
62%
Flyers
58%
Rangers
47%
Hurricanes
38%
Devils
25%
Blue Jackets
24%
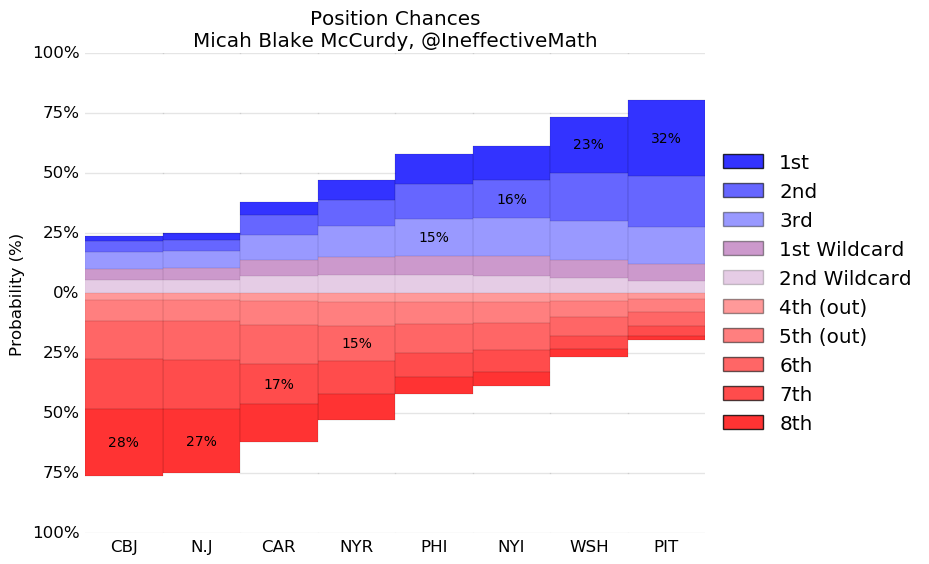
The Metropolitan division is a little more stratified, without so much bunching of teams. The
Taylor Hall trade is a big improvement for New Jersey but they need a lot more pieces. The two
middle teams (NYR and Philadelphia) rely more than the others on their goaltending, so there
may yet be confusion there. Pittsburgh look considerably stronger than most defending cup
champions, they've lost no substantial pieces.
Central Division
Team
Playoff Chance
Predators
82%
Stars
70%
Wild
65%
Blackhawks
64%
Blues
62%
Jets
59%
Avalanche
21%
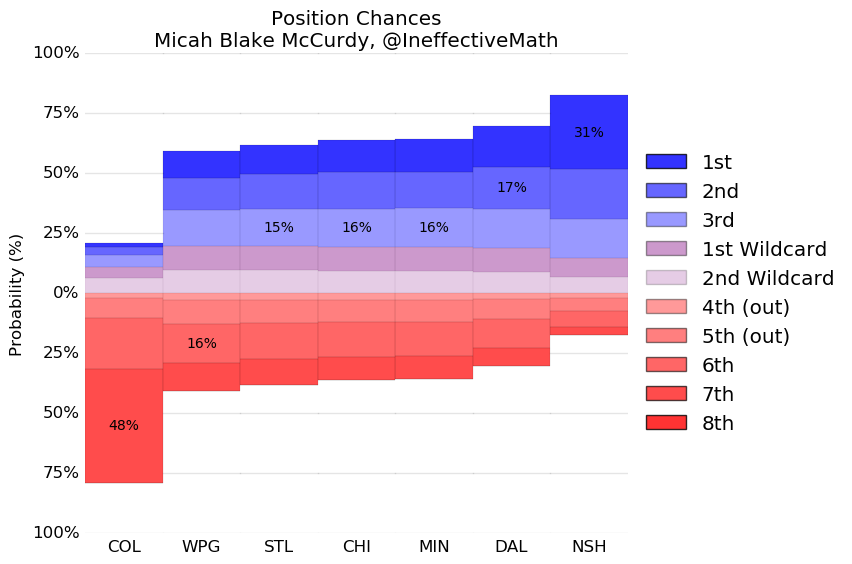
The Central is by far the tightest division in the league, with very little to choose
between among the middle five teams. Colorado are the clear runt of the litter, not least
because they have to play the other Central teams so much. Nashville is considerably
improved by the acquisition of Subban, which moves them to favourites for the division.
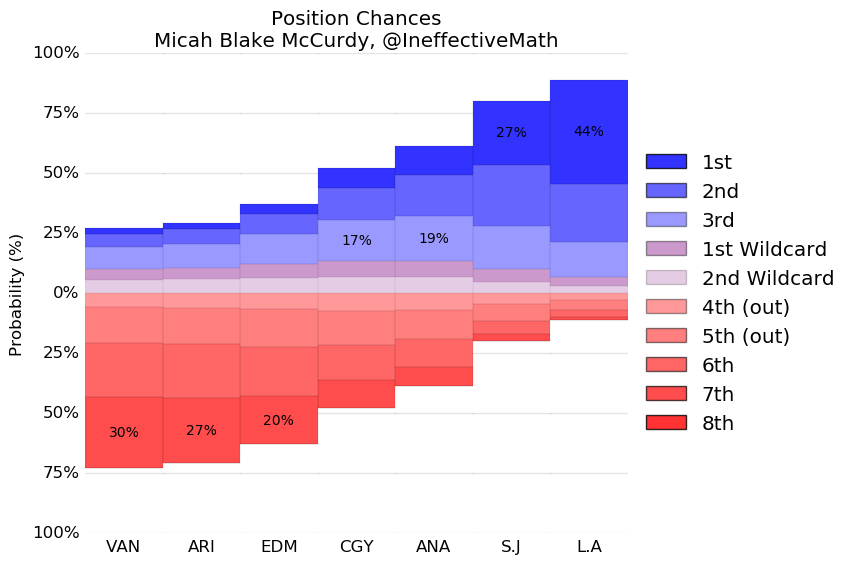
Pacific Division
Team
Playoff Chance
Kings
89%
Sharks
80%
Ducks
61%
Flames
53%
Oilers
37%
Coyotes
30%
Canucks
27%
Even with clear recent improvement, the Oilers still have lots of weaknesses; Vancouver
has made a number of very poor moves recently and is almost certain to be very weak; and
Arizona's playoff hopes rest on several of their young players showing strengths they have
not previously shown signs of. The traditional powerhouses of Los Angeles and San Jose look
every bit as strong as last year.
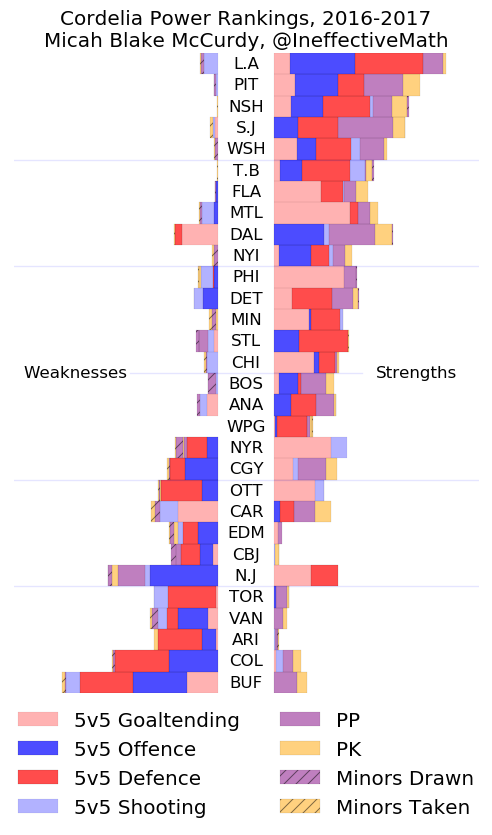
Stat Breakdowns
Based on their likely rosters throughout the season, the expected attributes for
each team are as shown to the left. Some teams are all-around power-houses, like Los Angeles,
Pittsburgh, Nashville, or San Jose, where some have many weaknesses, like Buffalo or Colorado.
Some very good teams are unusually reliant on
goal-tending, most obviously Montreal and Philadelphia, both of whom would be middle of the
pack without their excellent goaltending. Such high rankings are not undeserved---after all,
wins from great goaltending are still wins---but they are more fragile and prone to
variation, both that typical to the position and injuries, than rankings founded in other stats.
Conversely, a few teams have unusually weak goaltending, such as Carolina and Dallas; they
also could change considerably in strength.
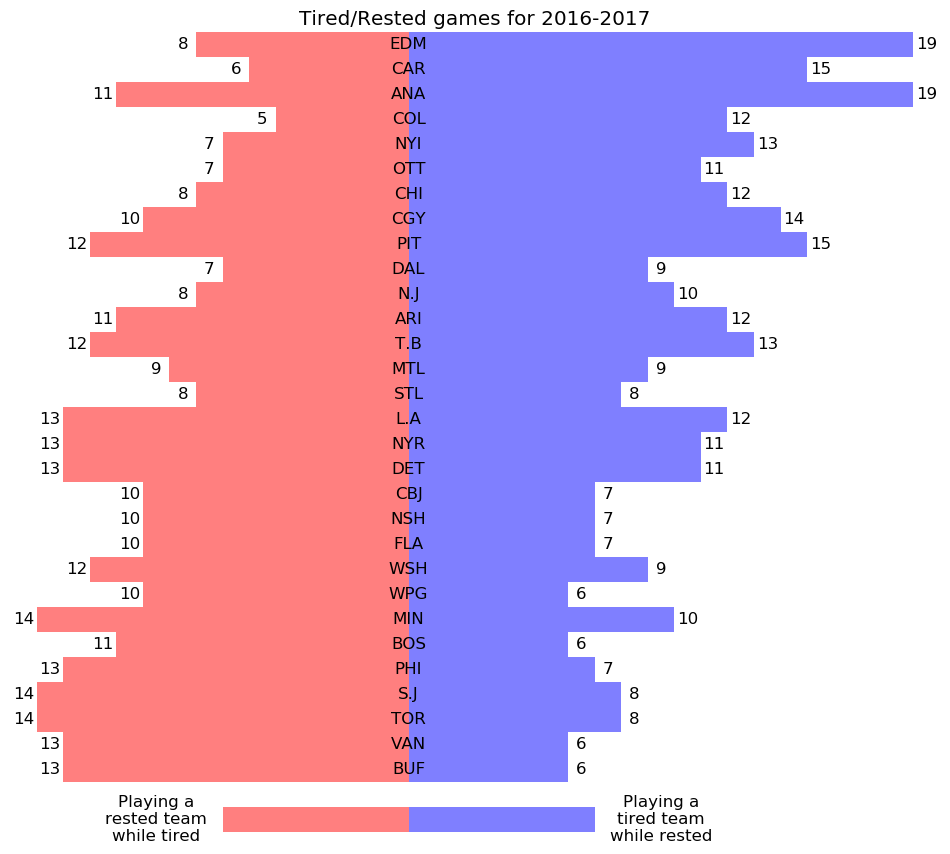
Rest
Not all teams are equally affected by rest. The strongest effects from rest are seen
when teams play after playing the night before. The table below shows how many times
each team plays 'tired' in this sense, as well as how many times they play against a
team that is tired.
Wooden Spoon
Since the league hasn't yet implemented Gold drafting, many teams will once again play many
games at the end of the year which they would rather lose. Although there will be many trades
and confusions between now and the end of the year, these are the early probabilities (including
all three lotteries) for who will get the 2017 first overall draft pick.
By far the largest weakness in my approach that I can discern is that no attempt is made
to account for coaching effects. For single players who change teams I feel that this effect
is reasonably small but for teams who change coaches the effects can be substantial. Some
teams (Colorado and Ottawa, noticeably) have substantially improved their coaching staffs since
any NHL games were played; those teams will probably do better than listed here although I am
at a loss to estimate just how much better. Some other teams (notably Anaheim) have substantially
weakened their coaching staffs, they will probably do somewhat worse than projected here. Other
teams have changed their coaching staffs non-trivially also though I am not sure if for the
better or for the worse.
Another (related) weakness is the failure to explicitly account for any context to the individual
elements that go into game predictions except for score-state. My previous work has suggested
that zone deployment is largely negligible; competition deployment may or may not be negligible;
and teammate deployment is certainly not negligible: none of them are explicitly included.
When teammates remain together the latter fault is small (it is implicitly present in the data and
preserved) but when players change teams it is larger. Thus my approach will only partially
account for players who change teams. I don't see a way to tackle this without modelling the way
in which two (or three, or four ...) players will affect one another's on-ice results; at the
moment this simply seems like a gargantuan undertaking.
Finally, player aging is not explicitly included, so players under the age of twenty-four or so
will be slightly underrated by Cordelia and players over the age of twenty-six or so will be slightly
overrated. I consider only results from the past two years in part to try to detect aging effects,
but teams with lots of young players will likely overperform their estimates here and teams with
heavy icetime to older players vice versa.
Post-Season Update
Now that the dust has settled, how did I do?
Team
Mean points (expected)
Actual points
Error (in standard deviations)
Penguins
100.0
111
1.3
Capitals
98.1
118
2.4
Lightning
97.8
94
0.5
Canadiens
96.4
103
0.8
Panthers
95.7
81
1.8
Islanders
95.3
94
0.2
Flyers
94.6
88
0.8
Red Wings
94.2
79
1.8
Bruins
94.0
95
0.1
Rangers
92.3
102
1.2
Hurricanes
90.4
87
0.4
Senators
90.2
98
0.9
Maple Leafs
87.8
95
0.9
Devils
87.3
70
2.1
Blue Jackets
87.1
108
2.5
Sabres
83.1
78
0.6
Hits: Lightning, Islanders, Bruins, Hurricanes, Sabres, all off by no more than 0.6
standard deviations (that is, about four or five points off).
Misses
Pittsburgh, Rangers, and Washington, probably since their shooting talent was undervalued;
Ottawa, likely wrong because of not accounting for coaching improvement;
Toronto, likely wrong by underestimating youth.
Detroit, likely wrong by overestimating age.
Flyers and Canadiens, for no reasons that I can perceive.
Big Misses
Columbus, badly wrong, probably due to underestimating young players and
failing to predict a Vezina-calibre season from Sergei Bobrovsky.
Panthers, mostly due to severe injuries.
New Jersey, at least in part due to an unusually weak goaltending performance.
Team
Mean points (expected)
Actual points
Error (in standard deviations)
Kings
101.0
86
1.8
Predators
98.7
94
0.6
Sharks
97.7
99
0.2
Stars
95.2
79
2.2
Wild
94.0
106
1.4
Blackhawks
93.9
109
1.8
Blues
93.5
99
0.7
Ducks
93.0
105
1.4
Jets
92.9
87
0.7
Flames
91.1
94
0.3
Oilers
87.9
103
1.8
Coyotes
86.2
70
2.0
Canucks
85.6
69
2.0
Avalanche
84.2
48
4.4
Hits: Flames, Predators, and Sharks, off by only a handful of points.
Misses
Kings, likely due to overestimating old players, especially as their shooting talent falls off;
Stars, perhaps due to unexpectedly bad goaltending performances.
Minnesota, likely due to coaching effects.
Chicago, due to unexpectedly strong goaltending performance.
Jets, due to unexpectedly weak goaltending performances.
Oilers, likely due to underestimating young players and also unexpectedly
strong goaltending.
Blues and Ducks, for reasons I can't see.
Big Misses
Colorado, badly wrong, due to failing to account for aging, coaching, and unusually
weak goaltending.
Arizona and Vancouver, and I don't know why, although weak performances early
(and subsequent decisions near the trade deadline) exaggerates the discrepancy.